MIL-DTL-23919C(SH)
4.5.4 Temperature linearity testing.
4.5.4.1 Testing setup. The test tank shall be filled with seawater. Seawater shall not be changed for the
duration of temperature cycling. The temperature bath or heating/cooling element shall be set to a temperature that
will increase the temperature in the test tank to a minimum of 90 °F (32.2 °C). Temperature shall not exceed 93 °F
(33.9 °C). When temperature has reached a minimum of 90 °F (32.2 °C), the temperature control element shall be
reversed to begin cooling. The temperature shall be cooled until it reaches a point below 40 °F (4.5 °C). When
40 °F (4.5 °C) has been reached, the temperature of the seawater in the test tank shall be brought back up to the
initial starting temperature. The maximum temperature change in a 1-hour period shall not exceed 2 °F (1.1 °C).
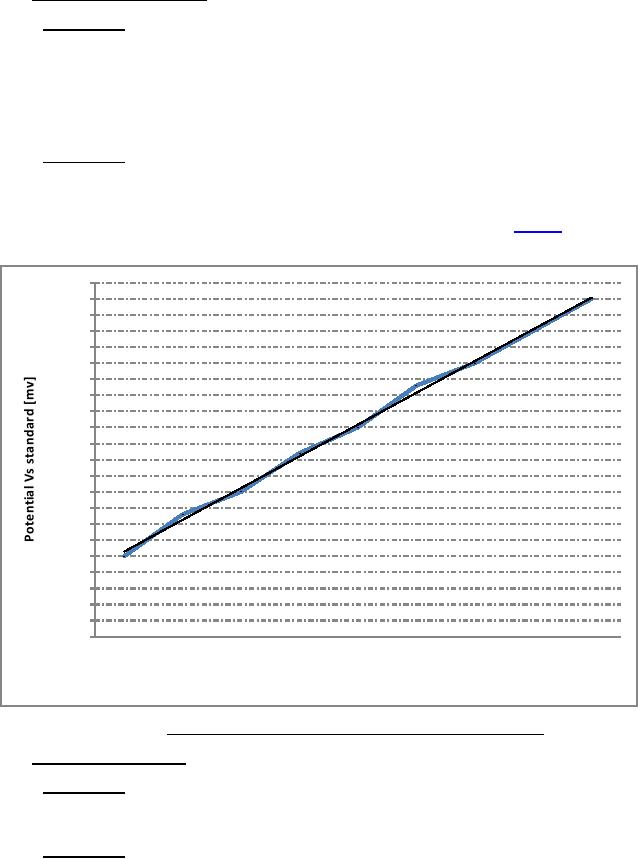
4.5.4.2 Data analysis. The DC potential readings between the standard Ag/AgCl cell and each of the product
form cells shall be determined every 5 minutes. The potential readings versus temperature shall be graphed. Linear
regression line shall be calculated from graphed data. The R-squared value (with minimum of 20 data points) for a
linear fit shall meet or exceed a value of 0.9800. While the slope of the line is dependent on the endpoints, the
R-squared values will indicate any deviations from linearity between these two points (see figure 1).
0.00
-0.50
y = 0.9867x - 9.3444
-1.00
R² = 0.9976
-1.50
-2.00
-2.50
-3.00
-3.50
-4.00
-4.50
-5.00
-5.50
-6.00
-6.50
-7.00
-7.50
-8.00
-8.50
-9.00
-9.50
-10.00
-10.50
-11.00
50
55
60
65
70
75
80
85
90
Temperature [oF]
FIGURE 1. Acceptable deviation from linearity during temperature testing.
4.5.5 Water resistivity linearity.
4.5.5.1 Testing setup. The reference electrodes shall be cycled through seawater solutions of varying
resistivities. Target resistivities are 18±1, 36±2, 72±5, 144±10, and 288±20 ohm-centimeters. Solutions of varying
amounts of seawater and fresh water shall be mixed to achieve the targeted resistivities.
4.5.5.2 Data analysis. The DC potential readings between the standard Ag/AgCl cell and each of the product
form cells shall be determined and plotted for each resistivity level. This value shall be measured at the same time
index following the water change for each test solution resistivity. This time index shall not be less than 24 hours.
Potential readings versus resistivity shall be graphed on semi-log graph. Linear regression line shall be calculated
from graphed data. R-squared value shall meet criteria specified in 4.5.4.2. Any deviation from linearity within the
upper and lower limits of the test shall be immediate cause for rejection of the reference element.
7
For Parts Inquires call Parts Hangar, Inc (727) 493-0744
© Copyright 2015 Integrated Publishing, Inc.
A Service Disabled Veteran Owned Small Business